ELK Monitoring – Part 3 – Setup Kibana
In this blog article, we will set up and run Kibana in our local machine. We will also use REST APIs from elastic to create indexes and documents manually using DSL query.
For a better understanding, it is recommended to go through the blog articles on ELK topic in order from 1-6
https://myknowtech.com/tag/elk

– Open source visualization tool on elastic data
– It uses the REST API provided by elasticsearch and queries the data.
– It ships with a nice user interface to create visualization and dashboard on the elasticsearch data.
How to setup Kibana in Windows?
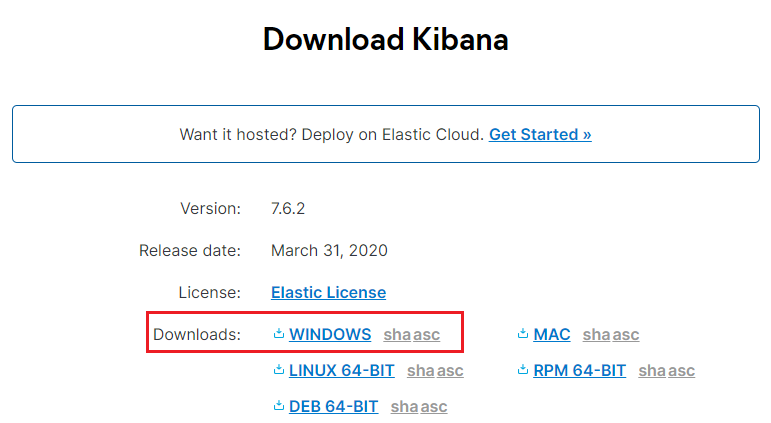
Step 1: Download the Kibana binaries
Enjoying this content?
Access the author’s full video courses here at MyKnowAcademy.
Explore Courses →
https://www.elastic.co/downloads/kibana
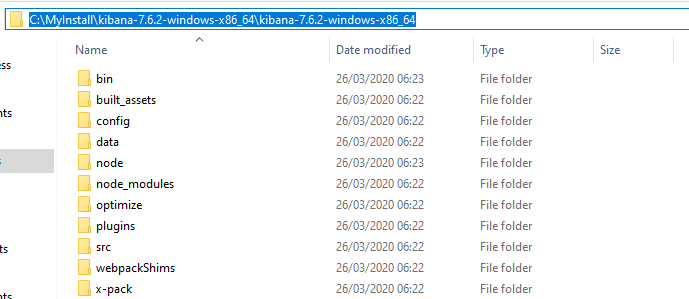
Step 2: Unzip and install the binaries in local machine.
Step 3: Setup some important configurations
In the config folder, you will find the kibana.yml file.
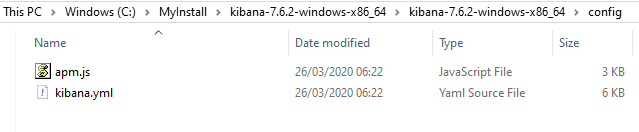
You can use your favorite editor to edit the file
a) Server configurations
By default, Kibana is reachable through localhost on port – 5601

b) Elastic server configurations
You can include the list of elasticsearch hosts in array format.
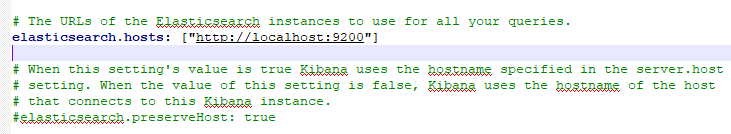
c) Other configurations – security, log, timeout settings.
Note: The comment description in the yml file is highly enough to know the usage of each field. Also if you host everything in your local machine, then no need to worry about any. The default configurations always apply to localhost server configuration.
Save the file after your configurations.
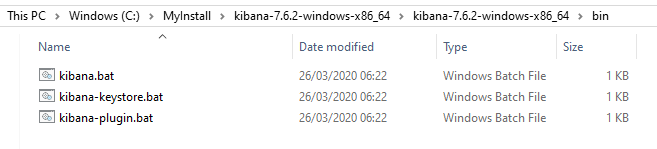
Step 4: Start the Kibana server
The Windows batch file to start the Kibana server stays in bin folder.
Open the Windows PowerShell and switch to Kibana home directory.
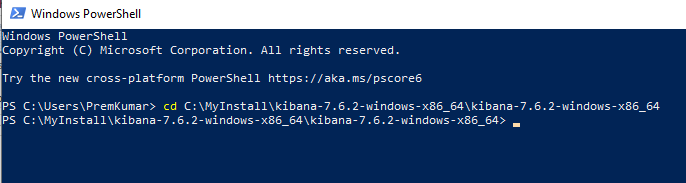
Now execute the below command – .binkibana.bat
You should see the running log message.
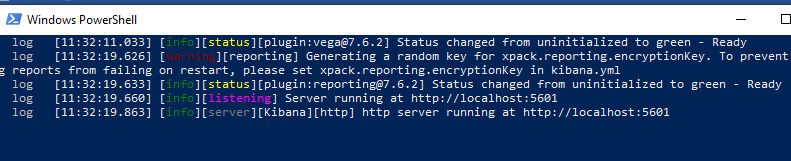
Step 5: Verify the Kibana server status
Click on http://localhost:5601
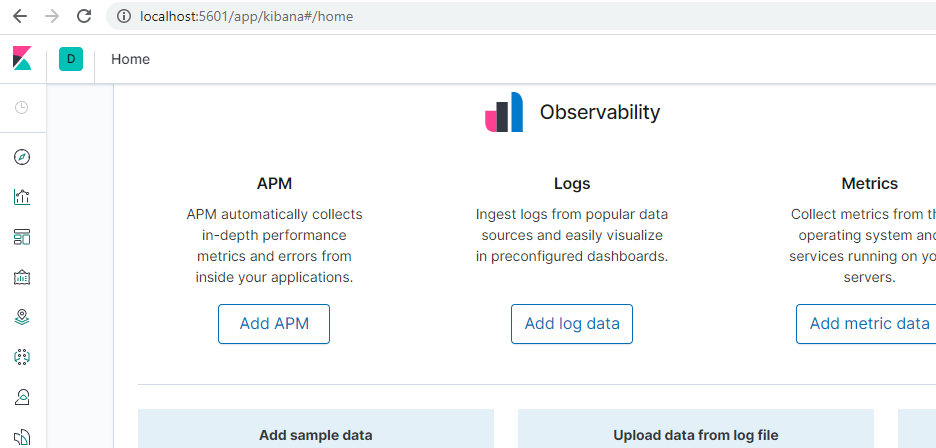
There you go, you have successfully hosted your own Kibana instance
How to setup Index pattern in Kibana?
Step 1: Click on the Management tab in the left navigation panel
Step 2: Create Index pattern.
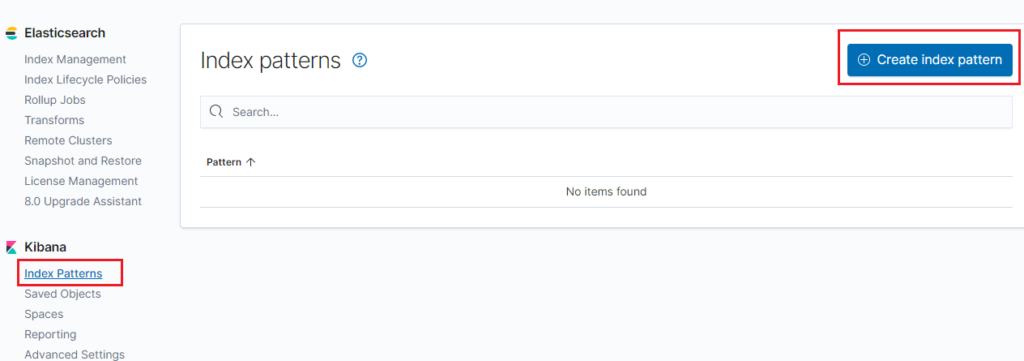
You will see a message like there is no Index data in the elastic search. Of course, yes! I just configured it hours before.

Let’s put out some data into elastic server.
How to create Index and documents in elastic server from Kibana?
Step 1: Click on the dev tools in the left navigation panel.
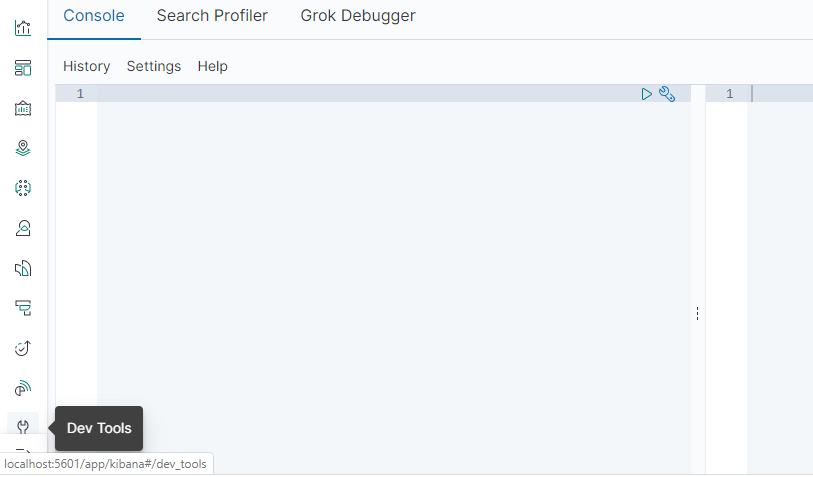
There you will get a console, from where you can execute API calls to elasticsearch server to create Index or documents, search documents etc.
Going forward, we will see a list of queries that server different purpose
Step 2: Execute create Index query
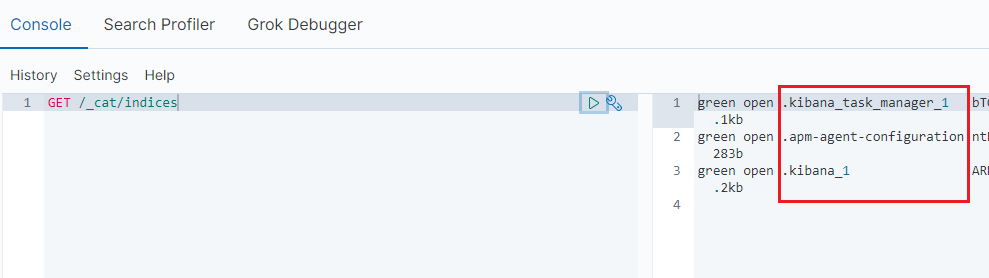
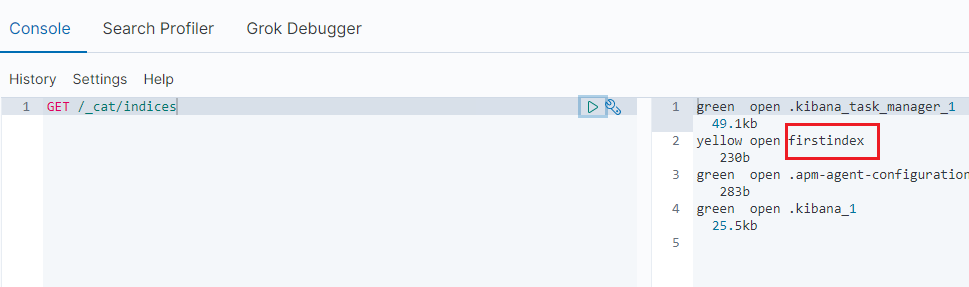
First, let’s check the existing Indices in the elasticserver
GET /_cat/indices
You see only some default Indices that start with a dot.
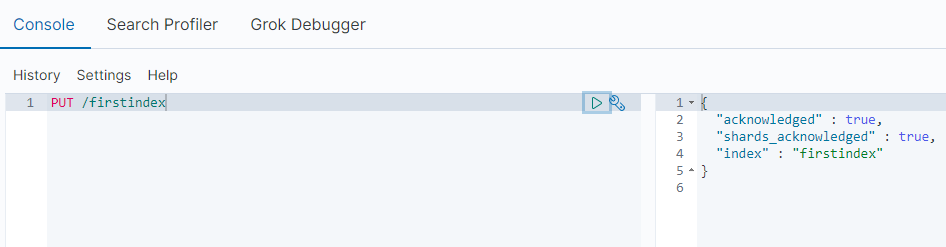
Now, let’s create a new Index
PUT /firstindex
Note: make sure you use lower-case letters
Successfully created. Now, again use GET /_cat/indices to get the list of indices in elastic server.
In the elastic server console, you will see corresponding log entry for the newly created Index.

Now, let’s ingest some data into elastic server for the newly created Index.
Step 3: Execute create document query
For creating a new document – firstdoc, provide the fields inside the JSON body in the below format.
PUT /firstindex/_doc/firstdoc
{
“user” : “prem”,
“message” : “this is the first message”
}
Now let’s search the Index – firstindex
GET /firstindex/_search
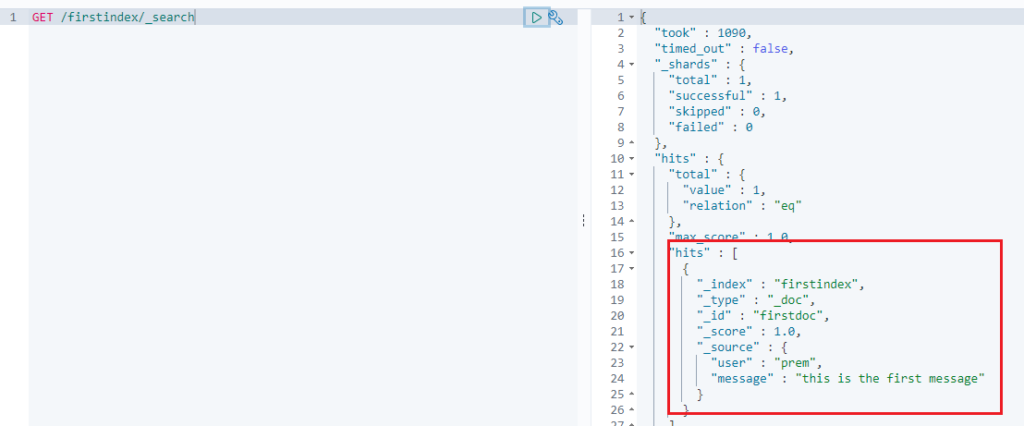
You see the query returns a hit count 1.
We have successfully created a new Index and added a new document to the index
Now go back to the Index pattern and create a new pattern
Step 3: Create an Index pattern for firstindex.
On the Management tab, create Index pattern.
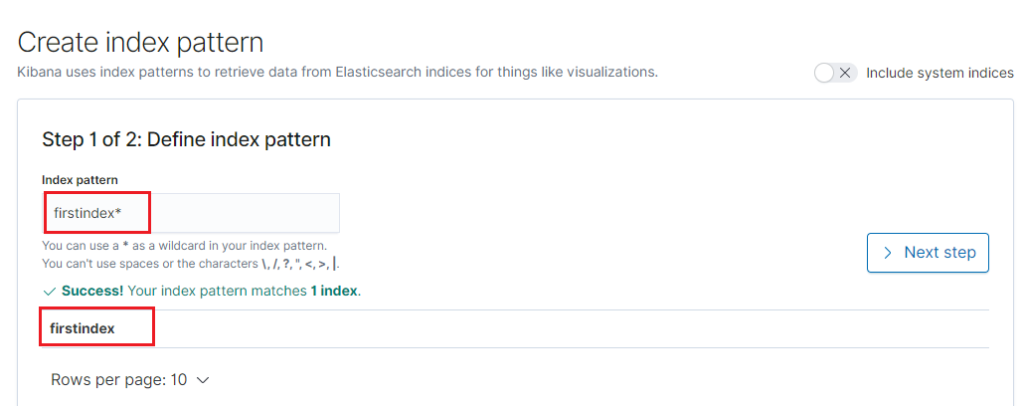
Finish the two steps to complete the configuration.
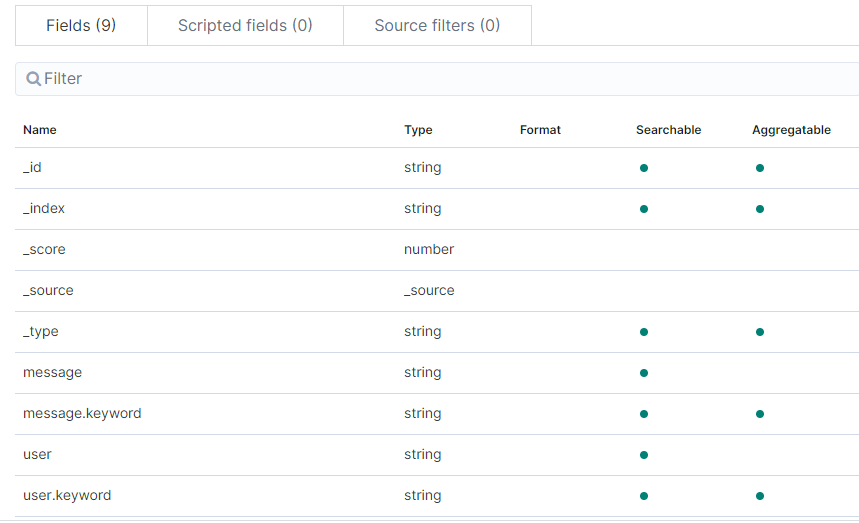
You will see there are 9 fields in the Index by default.
Final step – let’s use the discover tab to search the elastic server using nice UI.
Click on the discover tab in the left panel.
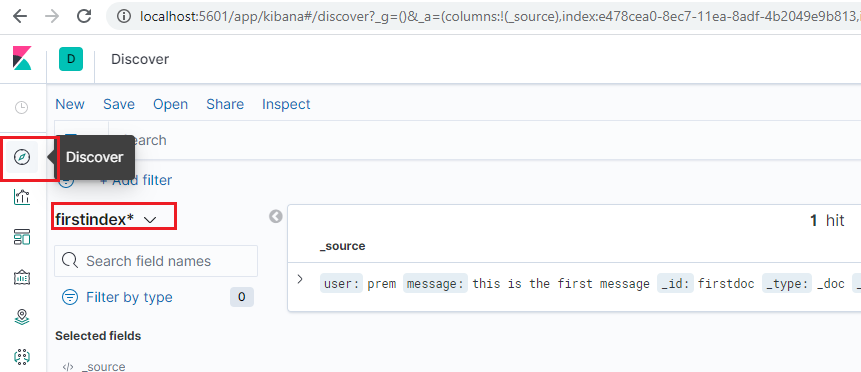
You can select on which index you need to query.
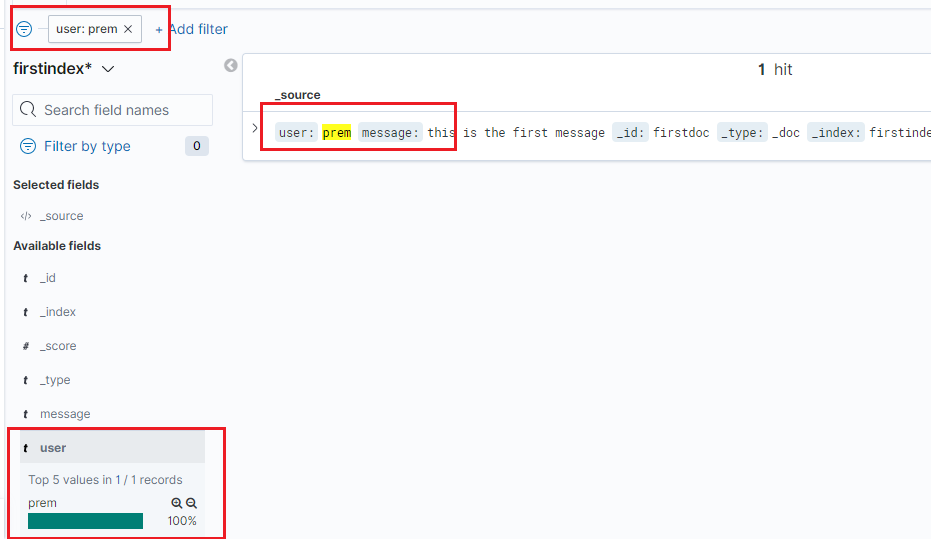
On the fields, you can click add to add it as filter.
You will see our only added document in the elastic server.
Once you created right query, you can use the menu bar, to save the query. You can also open/share the query link.
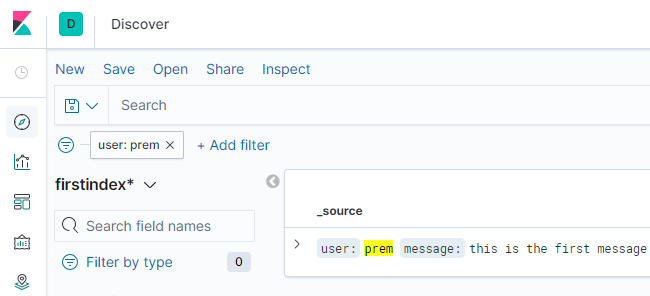
Clicking on search, Kibana makes an API call, just like we saw before using dev tool, to hit the elastic server and get the results.
We are end of the blog article
As a summary,
– We setup a Kibana server in our local machine.
– Using dev tools, we created a new index and registered a new document in the elastic index
– We created an Index patter for the newly created index.
– Using the discover tab, we are able to successfully query the document in the newly created Index.
Hope you enjoyed this article. Next is the very interesting post, where we will setup filebeat and inject Pega logs into elastic server and query the same from Kibana.