


In this blog article, we will set up a filebeat server in our localmachine. We will also use filebeat to ship the Pega logs into elastic server. Finally, we will use Kibana tool, to query on the shipped log entries from elastic server.
For a better understanding, it is recommended to go through the blog articles on ELK topic in order from 1-6.
https://myknowtech.com/tag/elk

What is Kibana?
– Open source server-side data shipper that has its own ecosystem. It is light-weighted
– Beats can either ship the log to Logstash or it can directly source to Elastic search.
Important note: Beats has to be installed in the host machine from where you need to ship the data!
In our current scenario, we are going to ship Pega log files. We are using Pega Personal edition and hence filebeat also be installed on my local machine
How to set up Filebeat in Windows?
Step 1: Download the Filebeat binaries
https://www.elastic.co/downloads/beats/filebeat
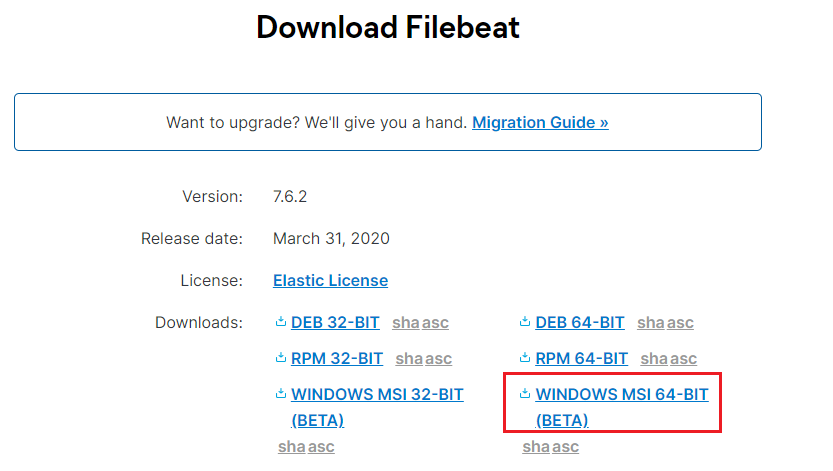
Step 2: Unzip and install the binaries in the local machine.
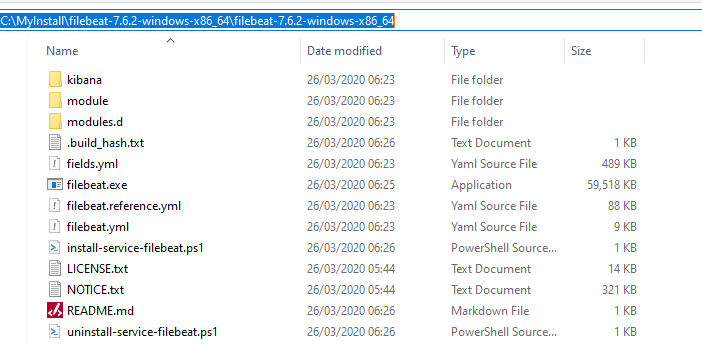
You can check the size of the software – it is just 60 MBs.
Now open the Windows Powershell as administrator.
Switch to the filebeat home directory.
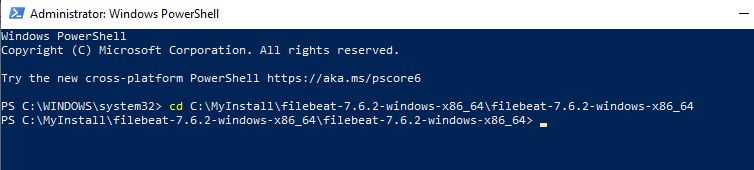
Execute the below command to install
.install-service-filebeat.ps
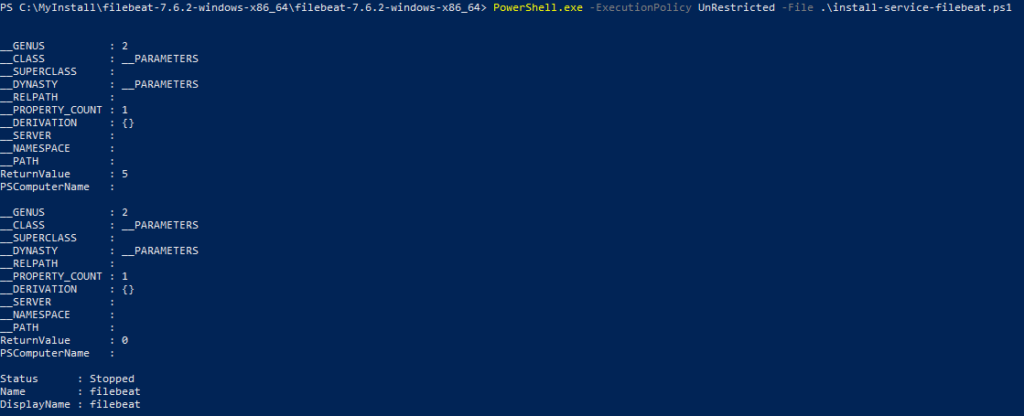
You may end up in an error like below.
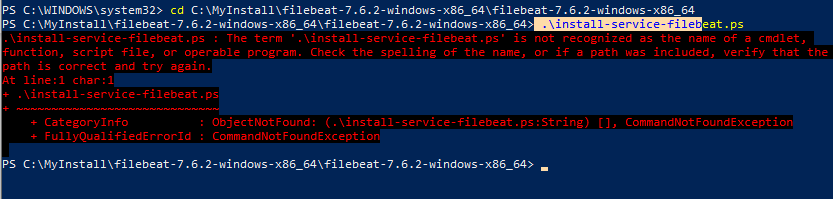
If yes, then execute the below command
PowerShell.exe -ExecutionPolicy UnRestricted -File .install-service-filebeat.ps1
Step 3: Setup some important configurations
In the home directory, you will see the configuration file – filebeat.yml
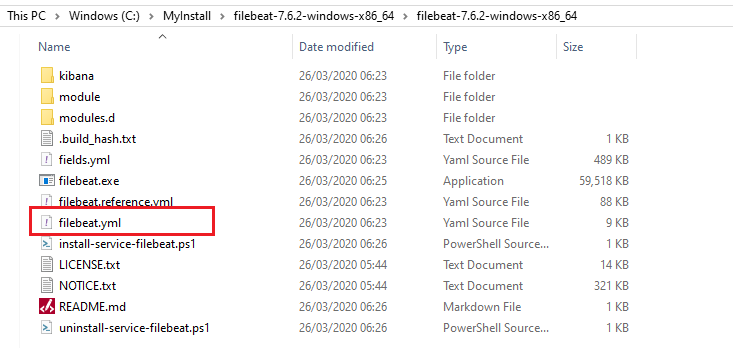
You can use your favourite editor to edit the file
a) Specify filebeat input
Type – log
Enabled – change it to true
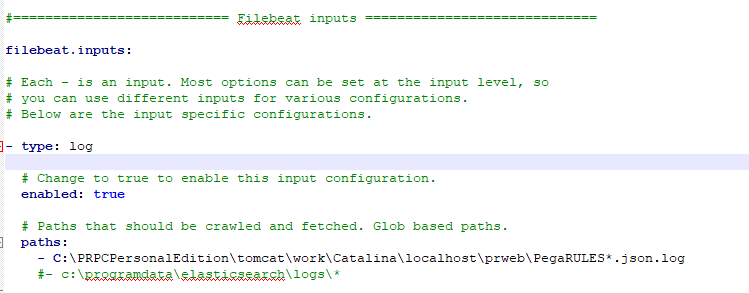
Paths – You can specify the Pega log path, on which the filebeat tails and ship the log entries.
Please add the JSON configurations that will help in parsing the Pega JSON log lines into individual fields.
For more info – https://www.elastic.co/guide/en/beats/filebeat/5.4/configuration-filebeat-options.html#config-json
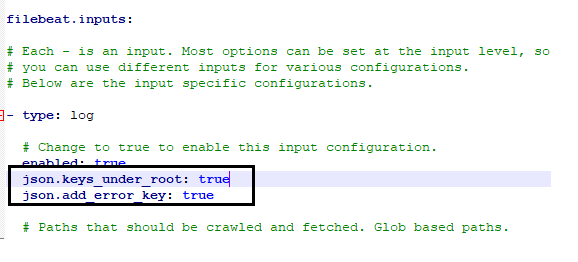
Note: In real time, you may need to specify multiple paths to ship all different log files from pega.
Let’s first check the log file directory for the local machine.
Based on your installation home directory, the path may vary
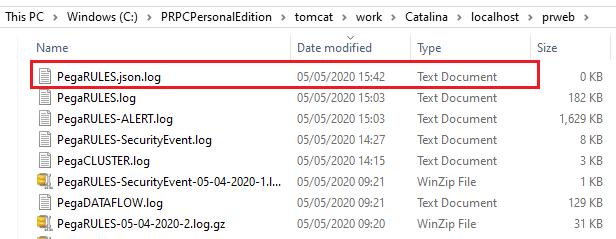
C:/PRPCPersonalEdition/tomcat/work/Catalina/localhost/prweb
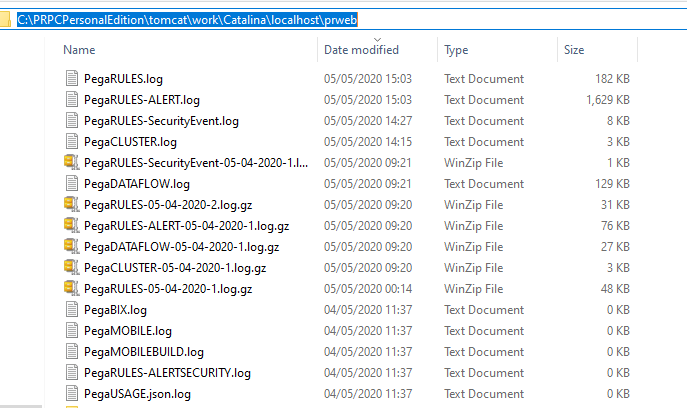
If you look at the configuration in filebeat, I gave it as JSON document.
Filebeat easily works with JSON file type and we do need to insert an additional log file, exactly similar to PegaRULES.log file content and name it as PegaRULES.json.log
First, we will finish the filebeat.yml configuration, before jumping into Pega log configuration
b) Specify filebeat output
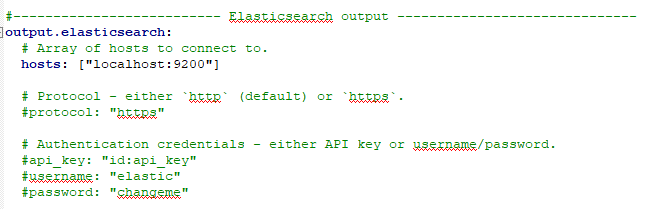
For now, I am skipping the Logstash part, in the next post I will cover it.
I am shipping the log files directly to elasticsearch server.
Save the file
Step 4: Start the Filebeat server
The Windows batch file to start the Filebeat server stays in bin folder
Execute the below command
.filebeat.exe -c filebeat.yml -e -d “*”– to run the filebeat in foreground
You can use ctrl+c to stop the foreground process.
Start-Service filebeat – starts filebeat in the background
Stop-Service filebeat – stops the filebeat
You will see continuous log messages scanning the input file location.

But we havent configured Pega to store a copy of log files in JSON. Let’s do that.
How to configure Pega to output log files as formatted JSON objects?
Step 1: locate the prlog4j2.xml file
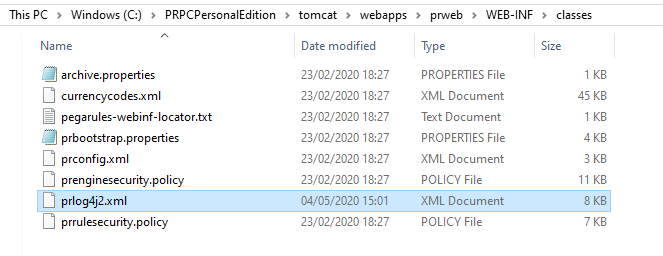
Step 2: Add a new appender and logger
For more info on Log4j2 file follow the link – https://stackify.com/log4j2-java/
For adding appender, I am copying the already existing JSON format appender for UsageMetrics
Note: this may not be available in lower versions!
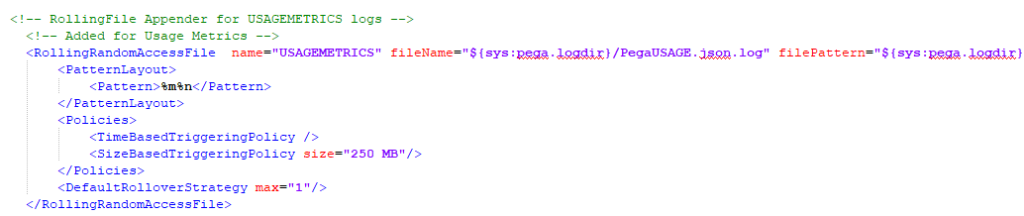
Add a new block below and change the naming conventions. Also remove the PatternLayout tags, which are not needed for now
I just added a similar block below with name = PegaJSON
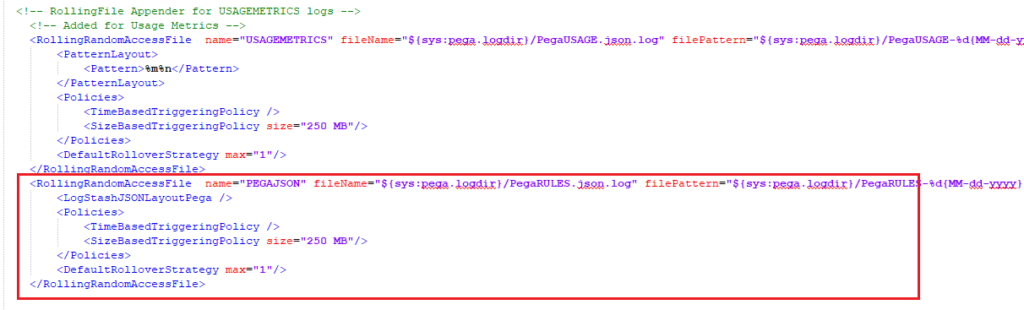
Named the file as PegaRULES.json.log
<RollingRandomAccessFile name=”PEGAJSON” fileName=”${sys:pega.logdir}/PegaRULES.json.log” filePattern=”${sys:pega.logdir}/PegaRULES-%d{MM-dd-yyyy}-%i.log.gz”>
<LogStashJSONLayoutPega />
<Policies>
<TimeBasedTriggeringPolicy />
<SizeBasedTriggeringPolicy size=”250 MB”/>
</Policies>
<DefaultRolloverStrategy max=”1″/>
</RollingRandomAccessFile>
You can also find the same code in the Pega knowledge article –
Added a logger entry for the new file.
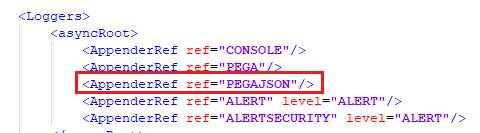
We are done with setting up filebeat to monitor the JSON formatted PegaRULES log file
Now save the file and restart Pega personal edition.
As soon as you restart, you should see JSON log file created in the log directory.
Also in the filebeats log, you should see the harvesting log entries.

All going good.
One final check is whether the data reached the elastic server
You will see a new index created log entry in the elastic server from filebeat.
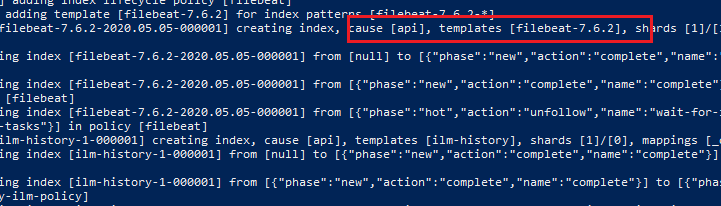
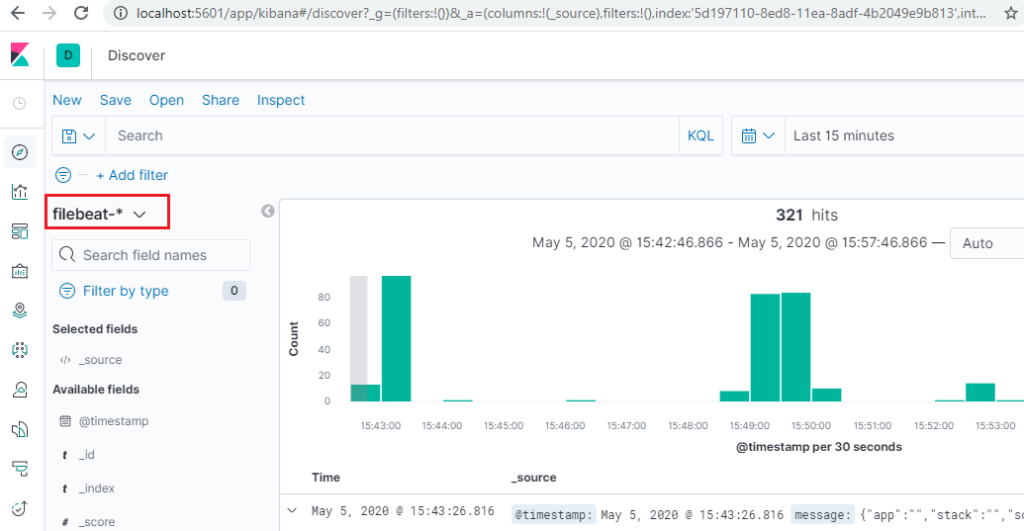
As the last stop point, let’s verify the documents from Kibana discover search
Step 1: Create Index pattern from Kibana Management tool.
You see the Filebeat Index already reached elastic, that’s why we are seeing it in Kibana.
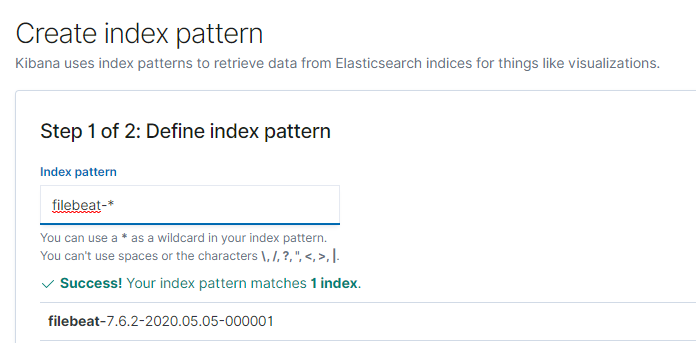
Use the filebeat-<> Index name
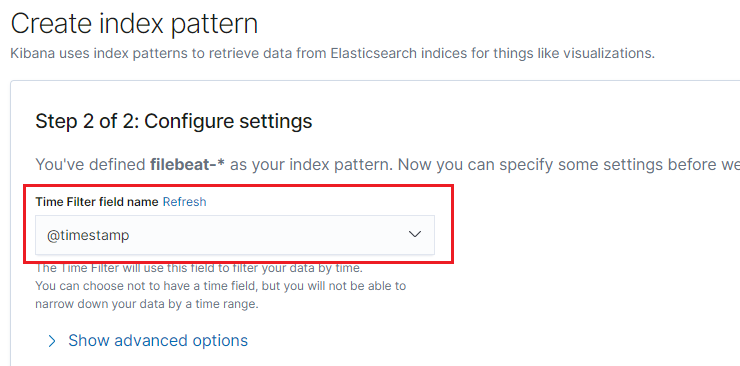
Use the @timestamp as the time filter field name.
Step 2: Use the discover tab to search the documents saved in the filebeat index.
We are done with the post here.
Just adding the pega nodes as the source of log file entries to elastic.
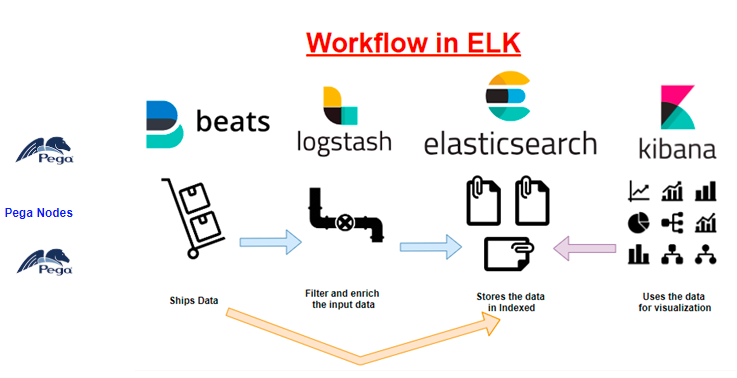
As a summary,
– We configured filebeat to run as a Windows service in the pega host machine
– Update Log4j2 file to create log files in JSON format
– Filebeat is configured to tail on the log files and ships the log to elastic server.
– Finally, we verified that Kibana can now monitor the Pega log files
You may get a few questions here –
a. Can we send additional fields to elastics – Like the system name – staging, prod etc
b. Can we have a specific Index like pega-events instead filebeat as index name??
In the next article, we will see how to use logstash between Beats and elastic server. There you will find the answers.