


In this blog article, we will see some important configurations in the report definition rule – Charts, report viewer and report editor.
Update: The concept of Report Definition rule remains the same across different Pega versions. Most of the screenshots in this blog article were reused from Pega 7 version and few were updated. Use this blog article to learn the concepts and you can try the entire tutorial in the latest versions as well.
To learn more about other Report Definition topics, visit the following link –
Let’s get started.
What are the types of reports?
There are two type of reports Pega supports.
1. List Reports
2. Summary reports.
What is List report?
This is the normal standard table format report.
Scenario– Get a list of sales instances.

You get a list of items here.
List report makes use of single value columns and not aggregate calculation are involved.
What is summary report?
This helps in displaying count, total, average.
Summary report also supports charting.
List report can be converted to a summary report by updating the summarize column in Query tab.
I am going to display a summary report on count of cases in different status.
From the list report, we can say
New =2 ; Open =1; Resolved – Completed = 1.
Let’s create a summary report to display the results.

I made an aggregate calculation on pyID row and pyStatusWork as sort order 1.
The sort order determines the result grouping. ( you can remove phone number – no use)
Save and run the report.
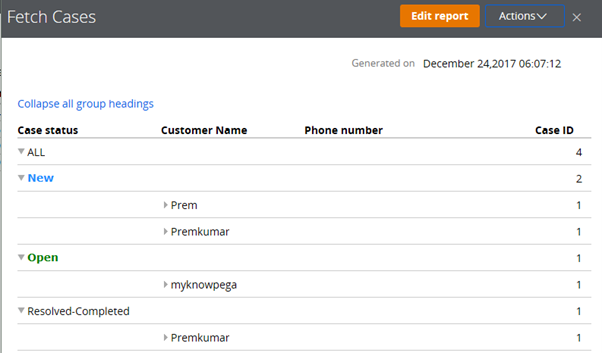
You can see the grouping and the case count ????
Summary report supports Charts. Charts serve to display the report results in pictorial representation.
Once you enabled summarize column in any row, you get the chart tab enabled for selection.

How to include chart?
Step 1: click on include chart icon in the chart tab
You get the chart editor.

You can select a chart type from different types available. I selected bar type
You also have some option to set legend and glider option.

You can drag and drop the columns in the drop zone.
Aggregate colmn – count(pyID)
Group by column – pyStatusWork.
You can also drop customer name column over the chart.


Save and run the rule.

You can see the report is rendered in chart.
This can be used in manager dashboard reports.
Report Viewer
Report viewer is the window which displays the report result, when you run it.

The configuration of report viewer is set in the report definition rule – Report viewer tab
Report Viewer tab
Report header

Note: You can customize the header by overriding pyReportEditorHeader section
You can configure, the report title and header display
Do not scroll header – You can freeze the header, when the results are large and involves vertical scrolling
Display filters using section –
You can also use custom filters using section.
How to implement using custom filters using section?
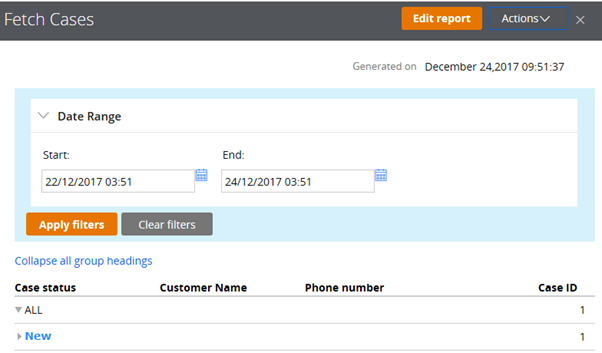
I have a requirement to have a filter section supports filtering based on pxCreateDateTime.
Step 1: Pega provides a sample section that is used to filter the results based on range.

The property referred are
Start : pyRuleStarts ; End : pyRuleEnds.
Note: You can create a similar one on your own ????
Step 2: Specify the section name and prefix

Display custom section inline – displays the filter section inline in report viewer. It not checked, it is visible in the modal dialog on click on filter section.
Step 3: Use the filter in the query tab. CustomFilter.pyRuleStarts / pyRuleEnds

Step 4: Save and run the rule.
Report body

Display actual data while editing report – While in report editor, you can see the actual data
Display rows in custom section – You can display rows in a custom section
Grouping

We can group the results and display values as group headings.
Records are grouped based on the sort order specified in the query tab.

You can see the records are grouped based on work status (Sort order 1)
User actions
These configurations determine what are the actions, user can perform on the report viewer.

Enable actions – determine what are the options to be available in the Other actions option.
Enable Paging – on clicking options, you get a modal dialog to configure.

Enable smart info – if required, you can show some additional information on each row.
Note: You make use of an activity that accepts pzInskey as parameter and returns the section content.
Report Editor
By default developer and manager role have the required privilege to edit report from the report browser.

Click on the edit report.
You can drag and drop the property either in the filtering area or results grid.

Click on the column heading menu. You can take action on the column heading

In the header area you can save your changes.
Let me how you a small demo, how to add a new column – pxCreateDateTime
Step 1: From the data explorer, select the pxCreateDateTime and drag and drop to a new column.

Step 2: You can select a data interval

Step 3: In the Header, click on done editing.
Step 4: Go to report definition and refresh the rule.

You can see a new row is added with the function we selected.
You can see how things are made easy.